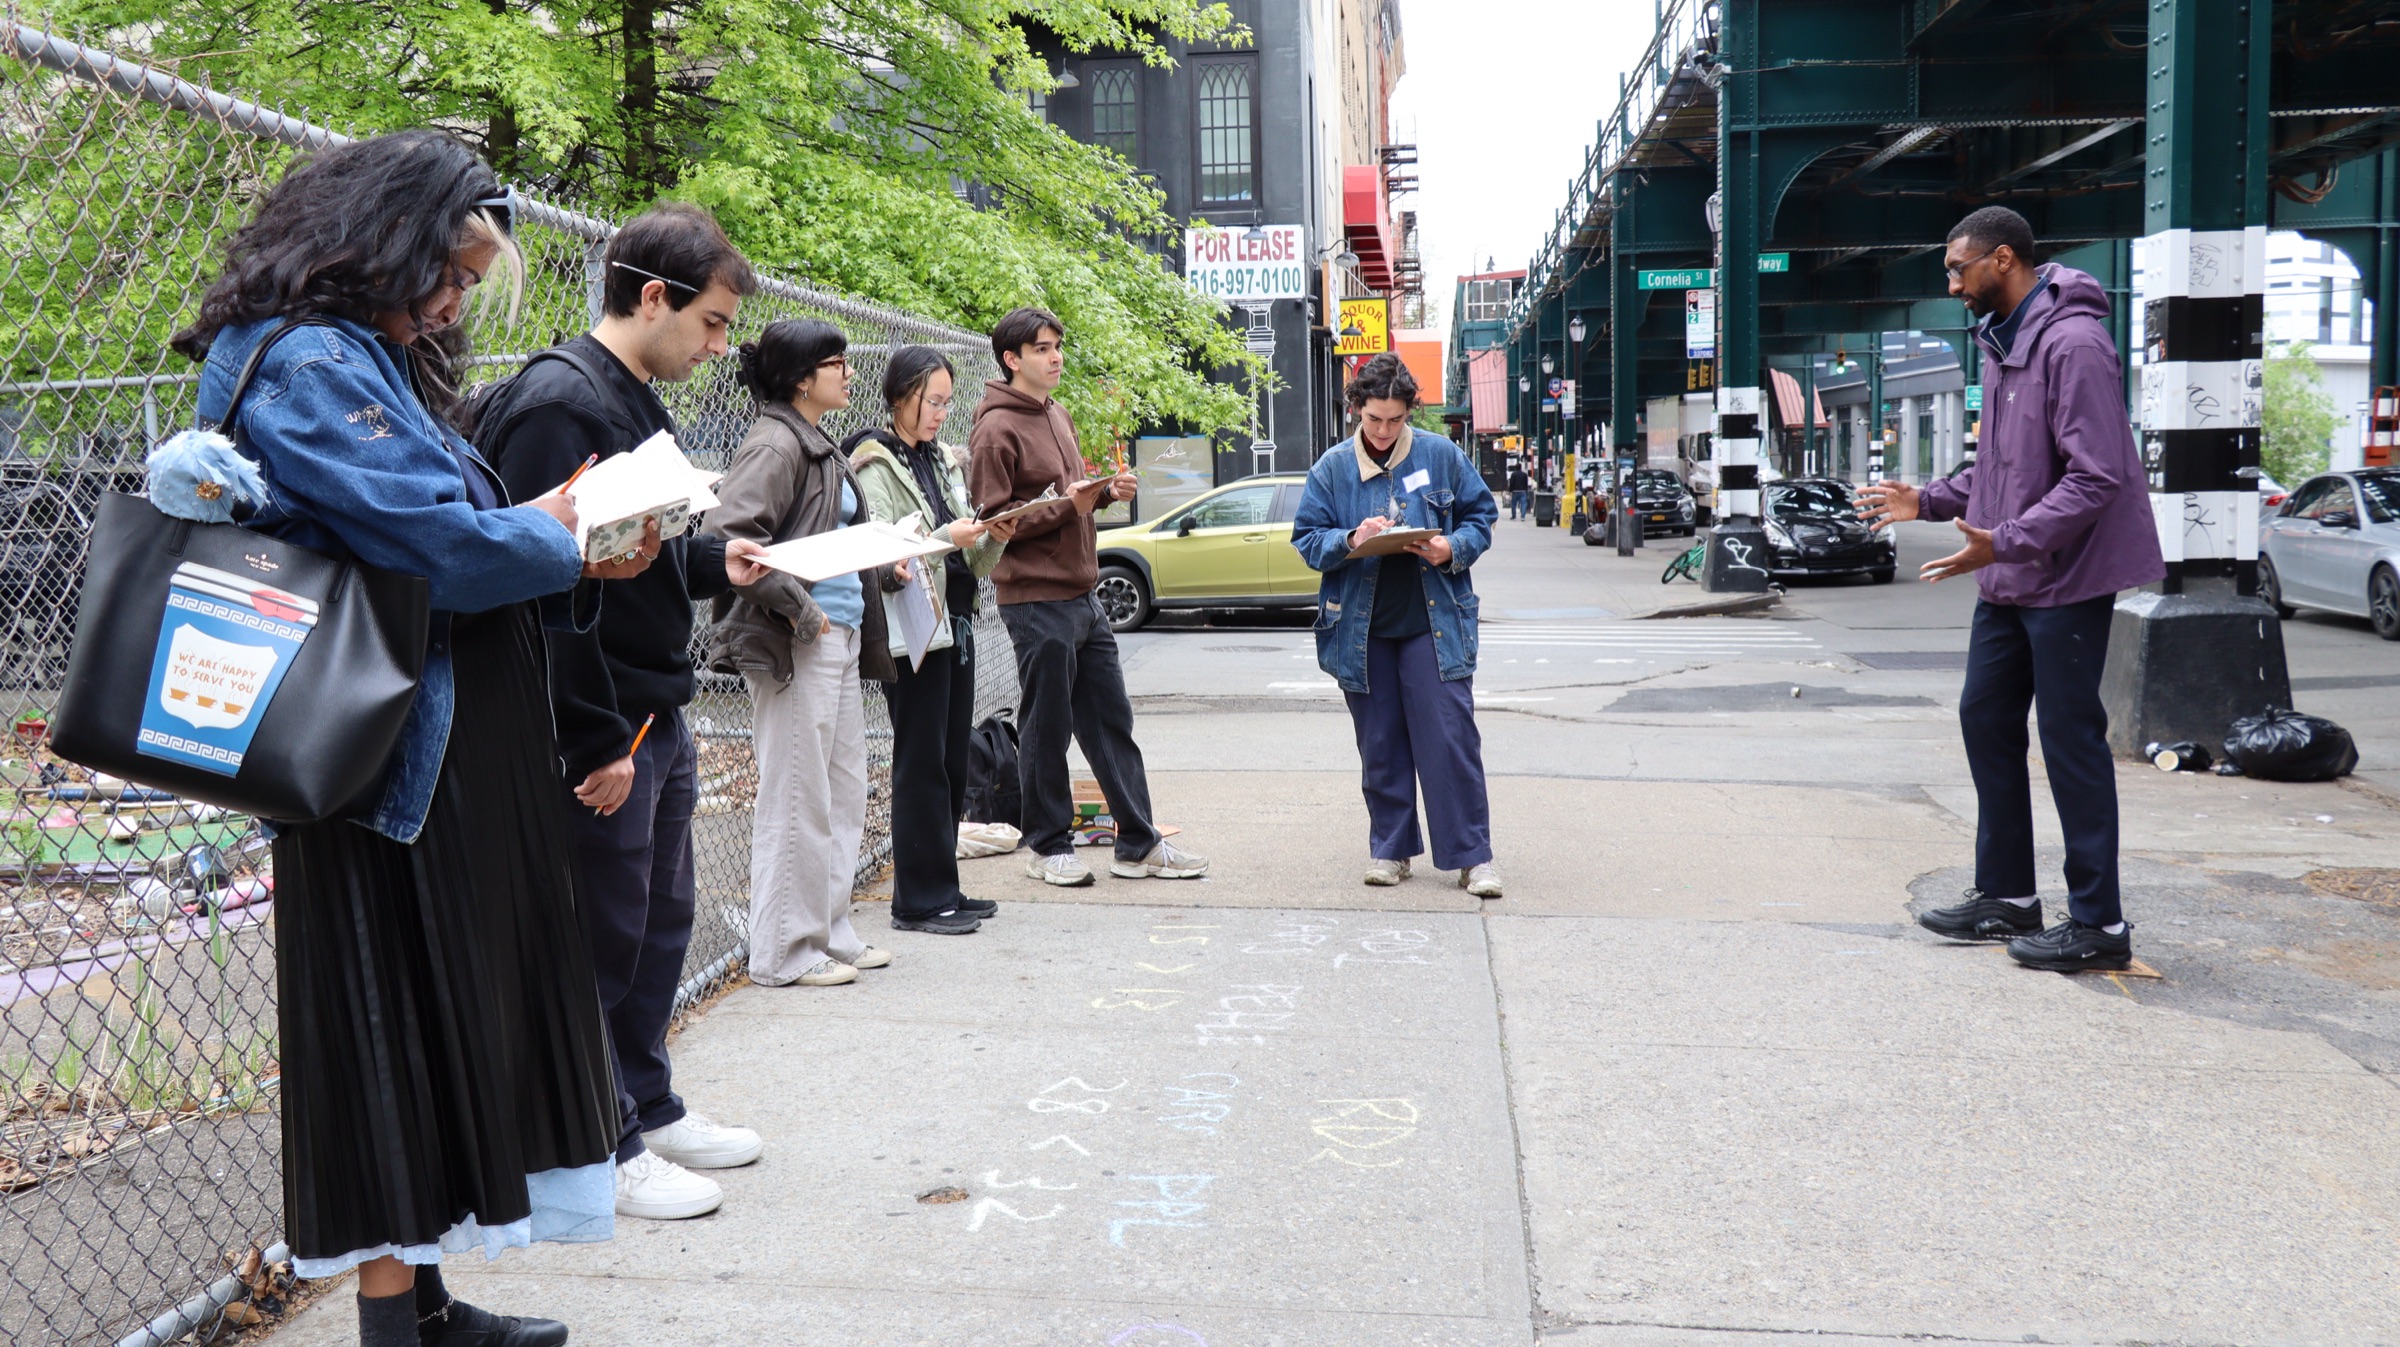
Measure
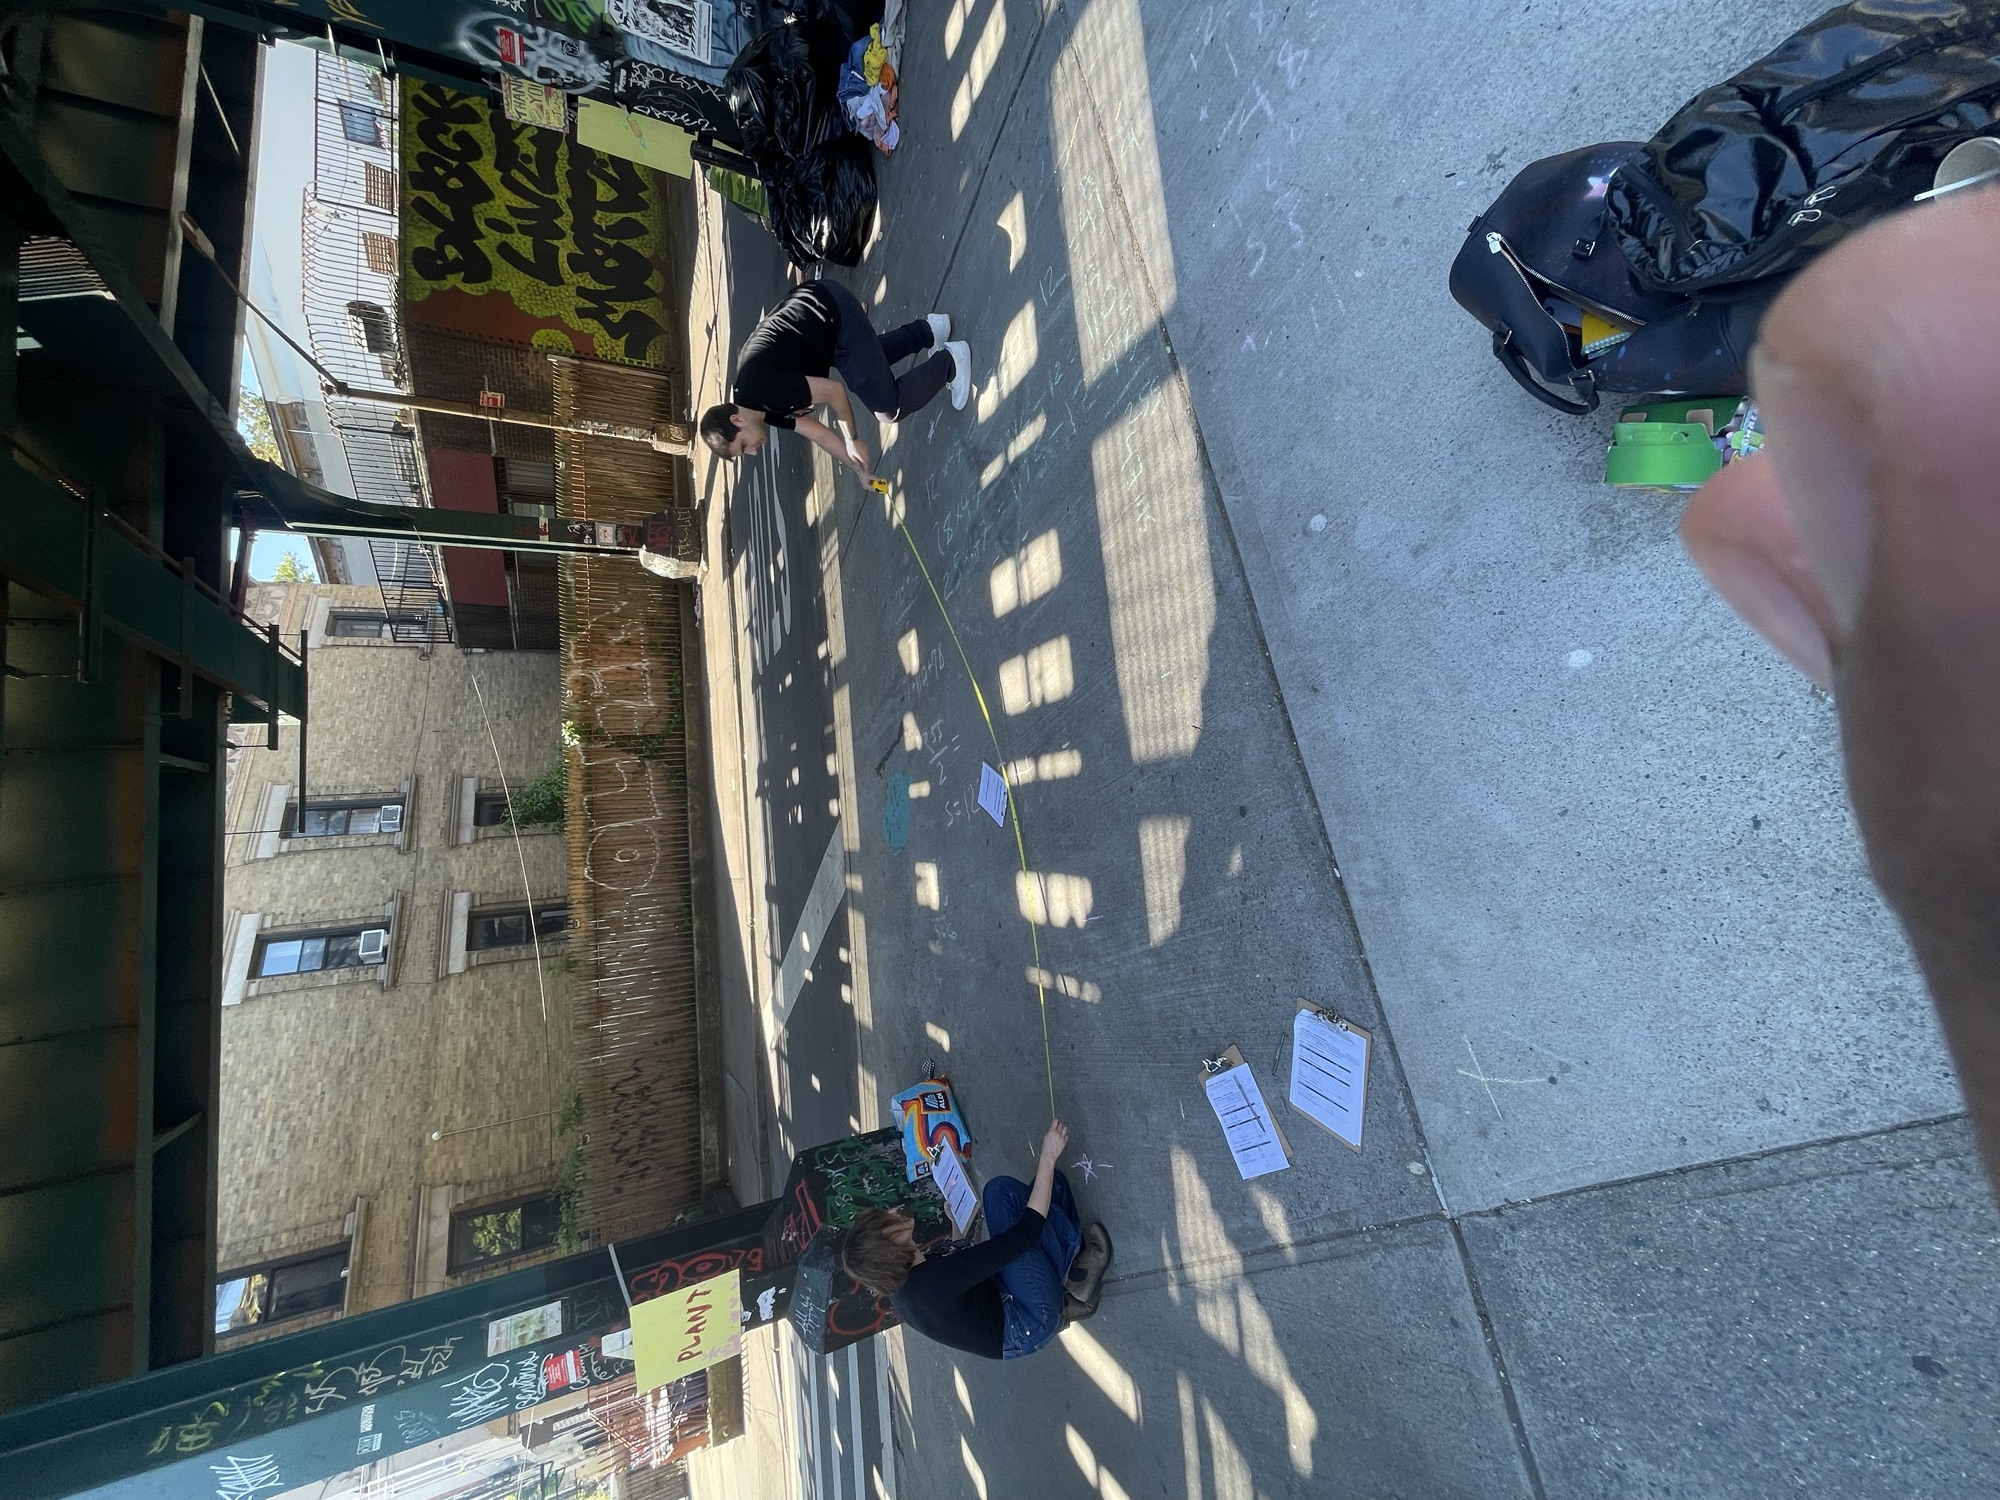
Count, pace, and time the street. The sidewalk is the dataset.
Model
Turn what we counted into a model, then test it against public data like PLUTO.
Design
Redraw the block. Sketch what better looks like, with the numbers behind it.
Advocate
Take the argument to the people who decide, with the math attached.
Start here
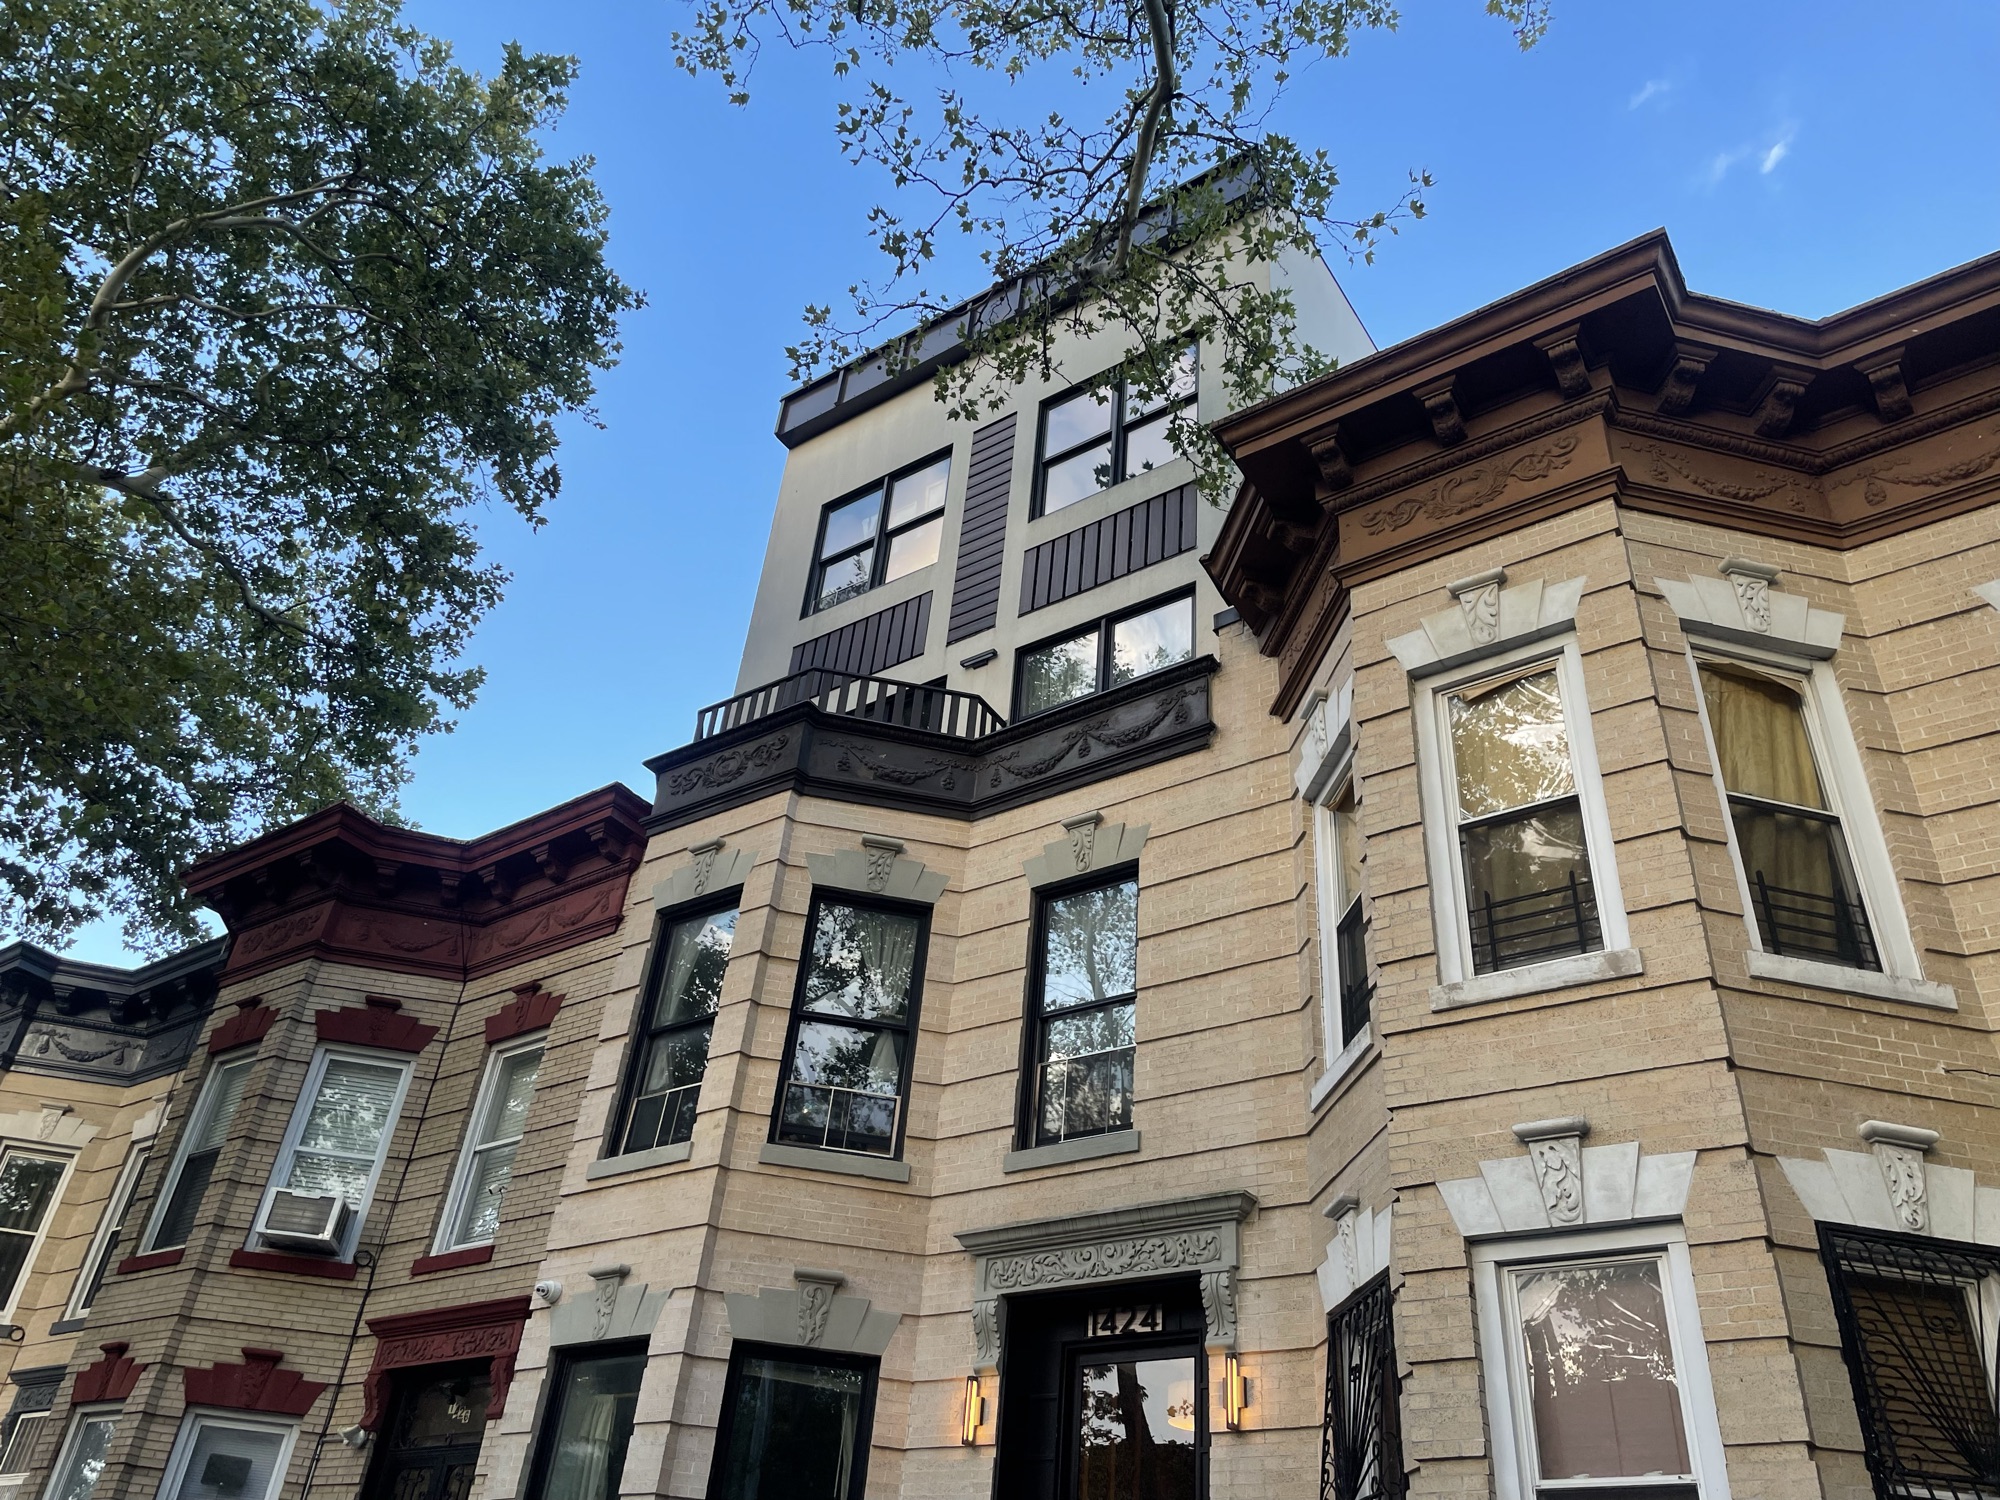
Why is a 19-story tower next to a 2-story rowhouse?
Same street in Bushwick. Same R6 zoning. Floor Area Ratio explains the gap and it'll show where the unbuilt room on the block actually is, and who could use it.
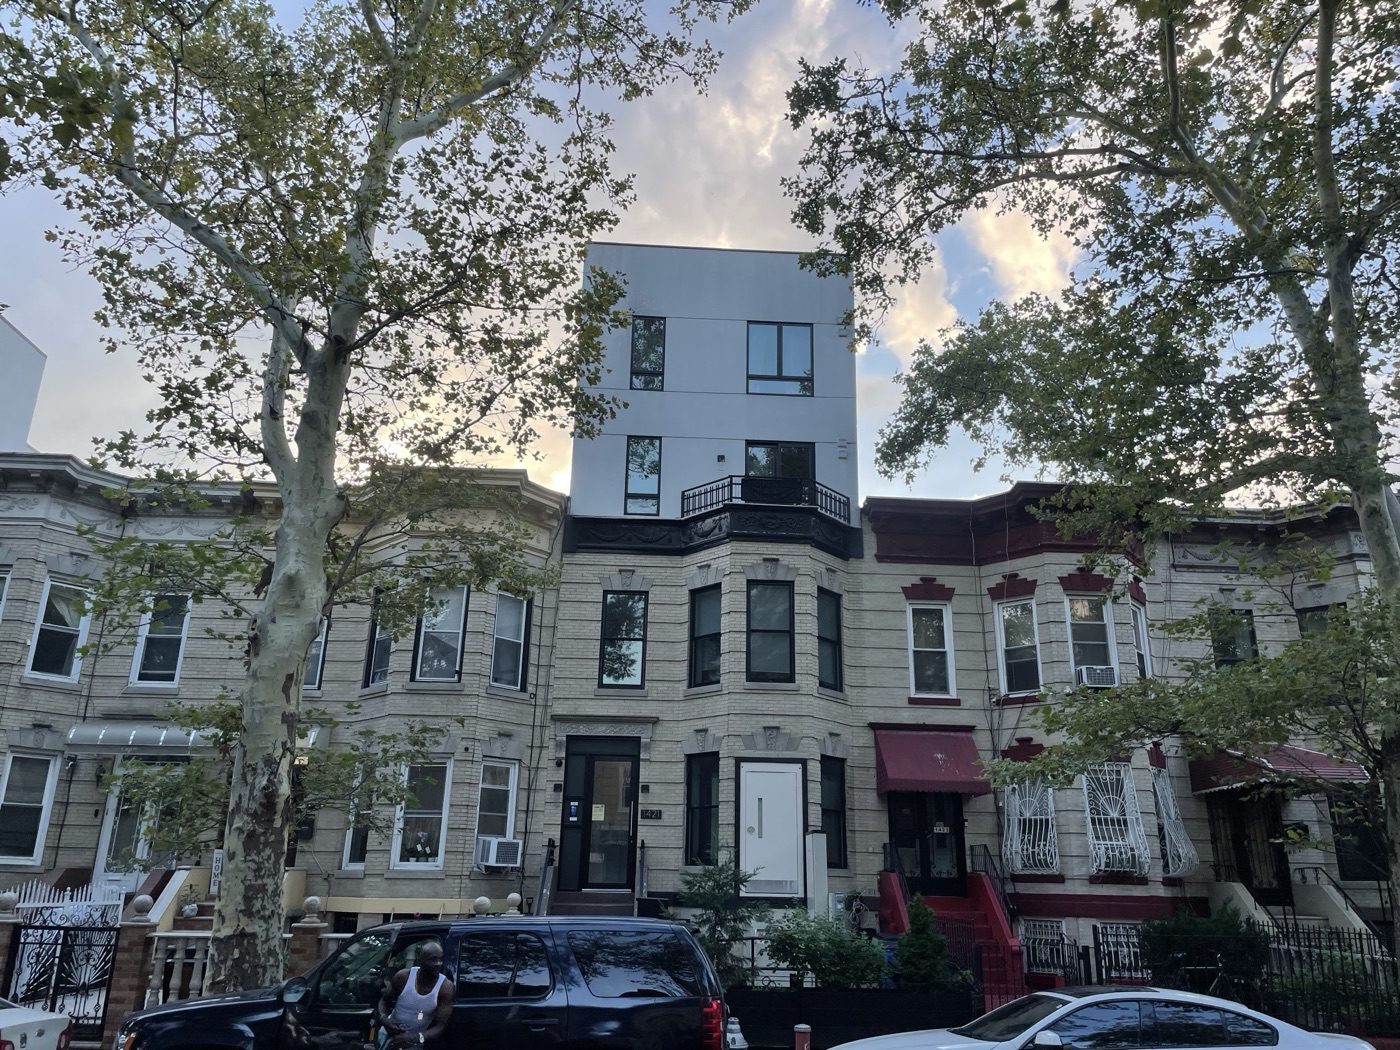
Same zoning. Nineteen stories next to two.
Cedar Street, Bushwick · Walk No. 03Walks
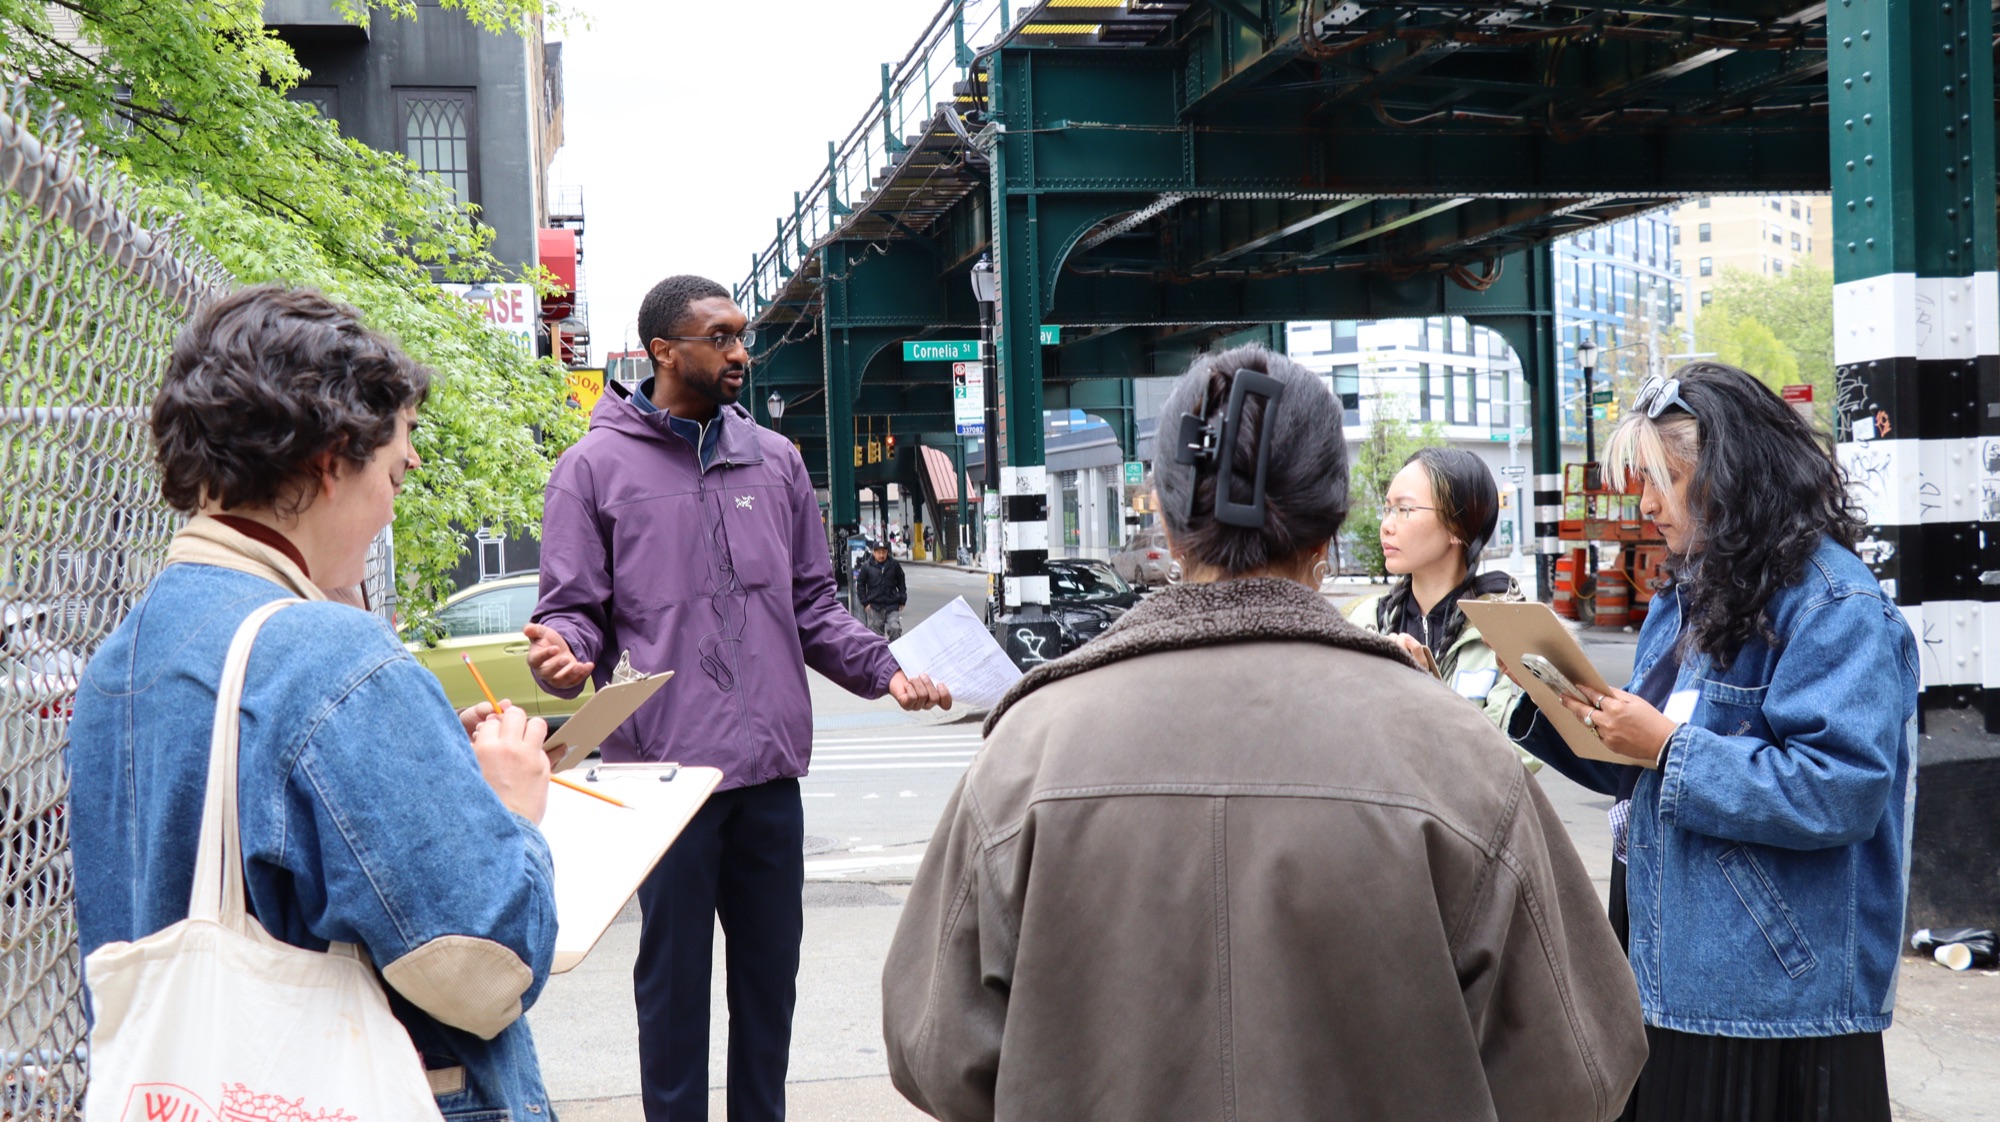
Each walk asks a question you can answer from the sidewalk, and ships with a field kit anyone can run.

Open questions
The Walkthrough is organized around questions you can answer with data. Each one gets a study, a map, and a walk behind it.

Math walks, after school.
Thirteen scholars, grades 5–8, meet twice a week in Bushwick to take the unit they just finished in class out into the neighborhood — scale drawings of their own schoolyard, a redesigned bus stop.
A Grade 7 curriculum aligned to NYS Next Generation standards is being built from it, one lesson at a time.
Writing
All posts on Substack
A math teacher who reads the city like a word problem.
The Walkthrough is run by Jordan, a 7th-grade math teacher in Bushwick and a former professional basketball player. It started as a way to get students outside with a tape measure and grew into a public series on housing, transit, and the street — in the tradition of Jane Jacobs, Robert Caro, Richard Rothstein, and Donald Shoup.